Pre-requisite
You should ideally be on an Advance subscription plan and should have taken a few trades from Terminal to see your trade data appear here.
Navigation
Dashboard->Reports->Orders->Order Details Page
When you click on any particular date from the orders page, you would be re-directed to this order detail page that would list down various data points and important metrics of your trades taken on that day.
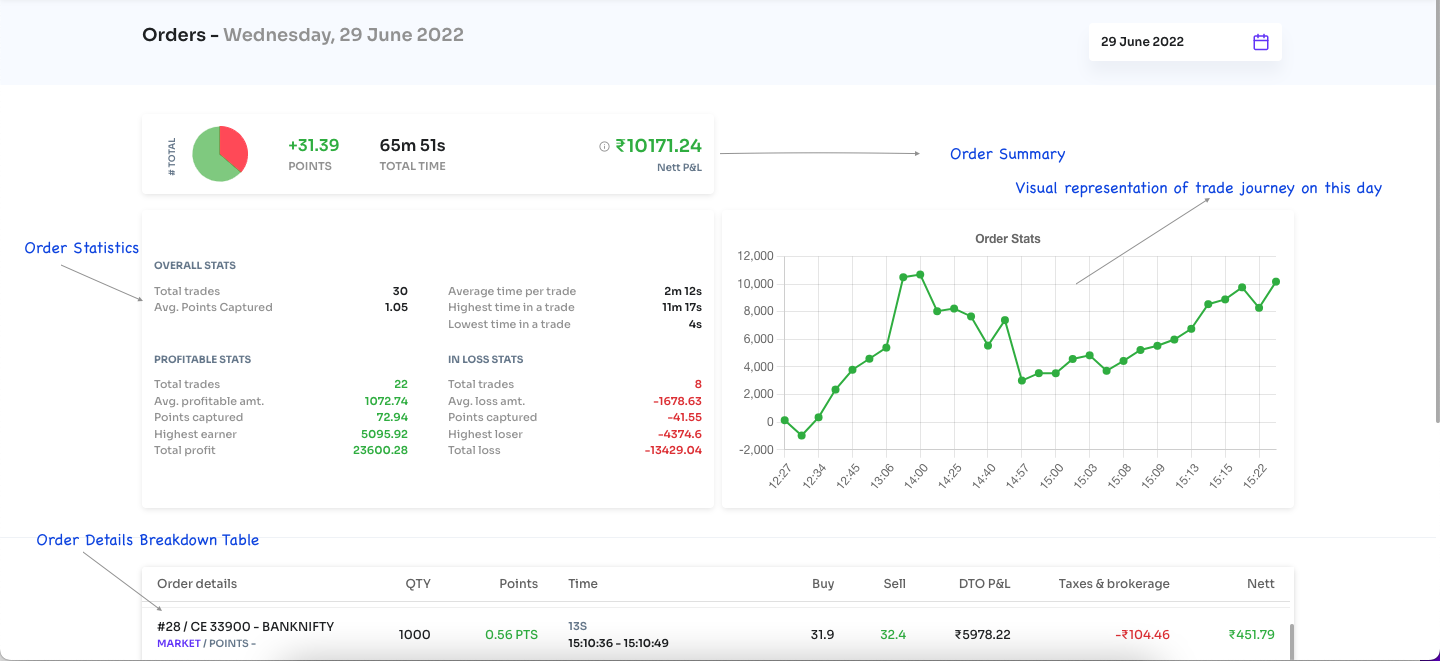
There are four important sections on this page. These sections are marked on the image & are explained one by one below:
Order Detail Page Explained
Order Summary
Order Summary is the very first section you would notice on this page.
- The pie diagram denotes the number of trades that were profitable & not profitable. Green denotes profitable trade number whereas red denotes the number of trades that made a loss.
- The next metric that you see is the total number of points that were captured by your trades on this date.
- Total time represents the amount of time you spent trading using Stolo on this date.
- The Net P&L is calculated after all tax and deductions for this day.
Order Statistics
Order statistics are designed to give you a detailed understanding of how did your trades perform on this date. It includes various crucial information which otherwise goes unnoticed by the naked eye.
The information includes the total number of trades, average time spent on trade, highest gainer, highest loser, highest time spent on trade, and so on. In addition to that, it also shows profitable trade(s) statistics along with loss-making trade(s) statistics.
Graphical Representation of Trade Journey
The next section that you see on this page is the graphical representation of your trade journey in Stolo. This graph plots each of your trades that you had taken on a date with timestamp along with Net P&L. The visual feedback is invaluable when it comes to identifying your trading performance for that date. You wouldn’t miss knowing which of your trades performed well that gained you higher profits as well as which of your trades incurred huge losses.
Order Detail Table
This section gives your a detailed understanding of each and every trade that you took on a particular date laid out in a tabular structure.
When you look at each row, you would be able to see the option you traded, point(s) captured, buy price, sell price, Net P&L, DTO P&L, and tax-brokerage deductions.